WIP Reporting and Cost Forecasting
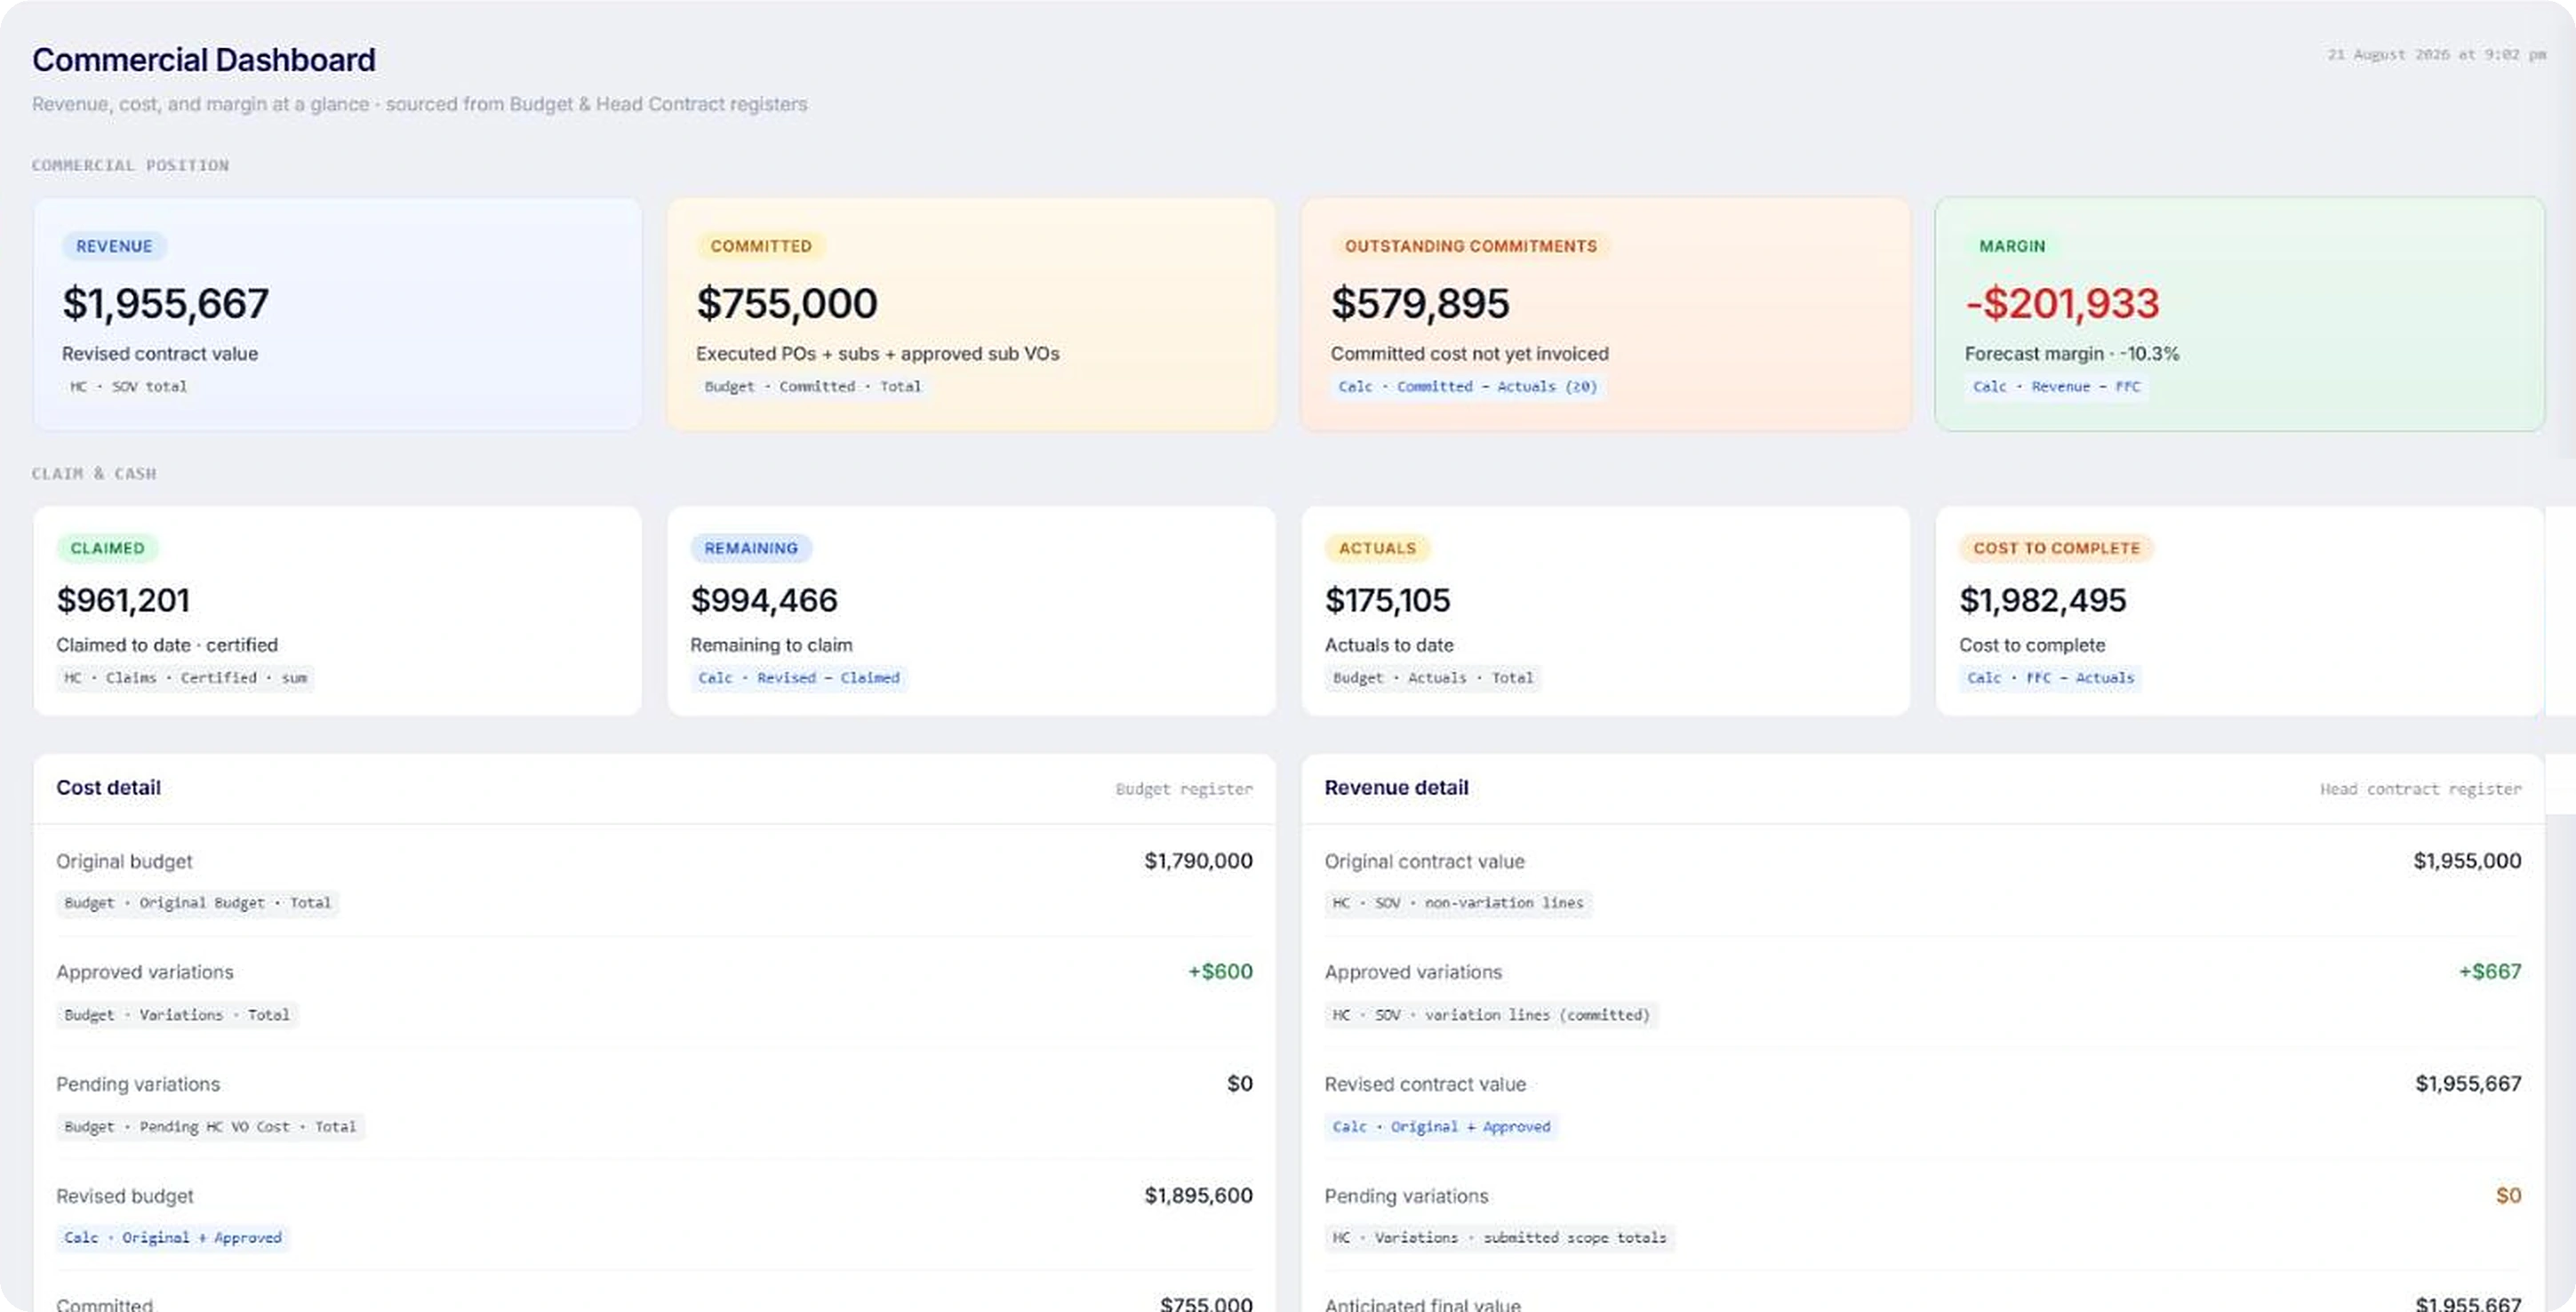
This job is going to lose $201,933.
It is August. The final account is
eighteen months away.
Most builders find out at the end. The cost report is assembled by hand, accurate the day it is produced and stale by the time anyone reads it, and by then the money is already spent.
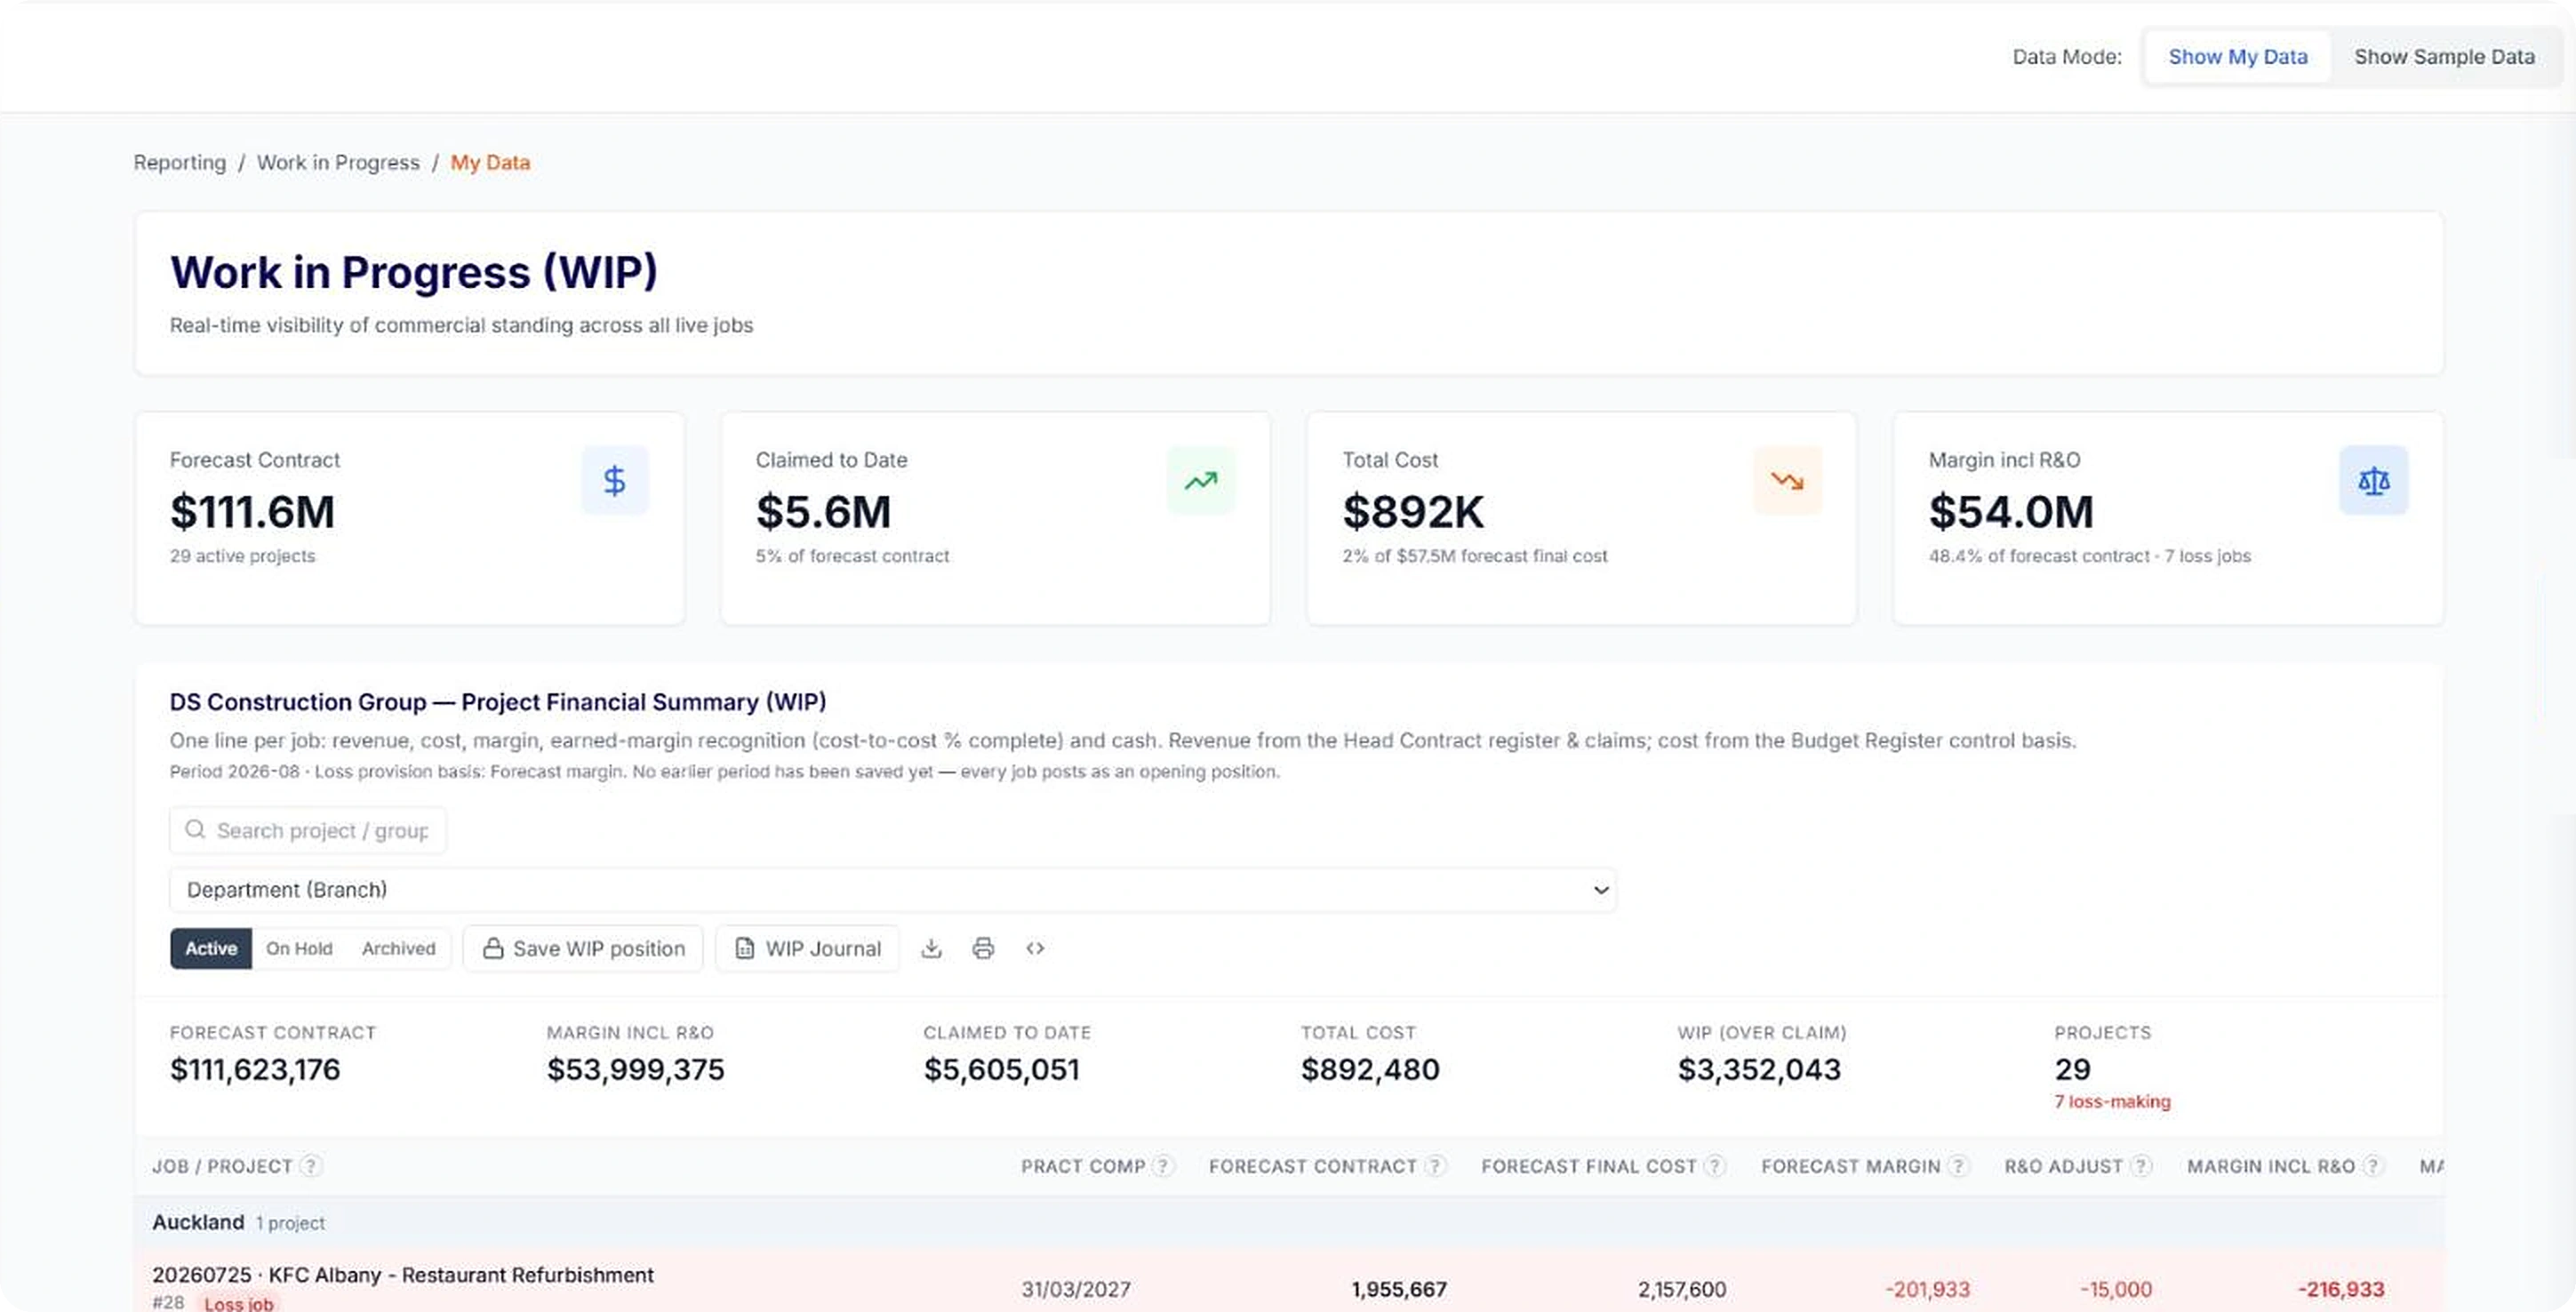
Deep Space gives you the WIP position of every live job, derived from the work itself, while there is still time to act.
One accountable statement per project,
derived from the work itself. Nothing on it is typed in.
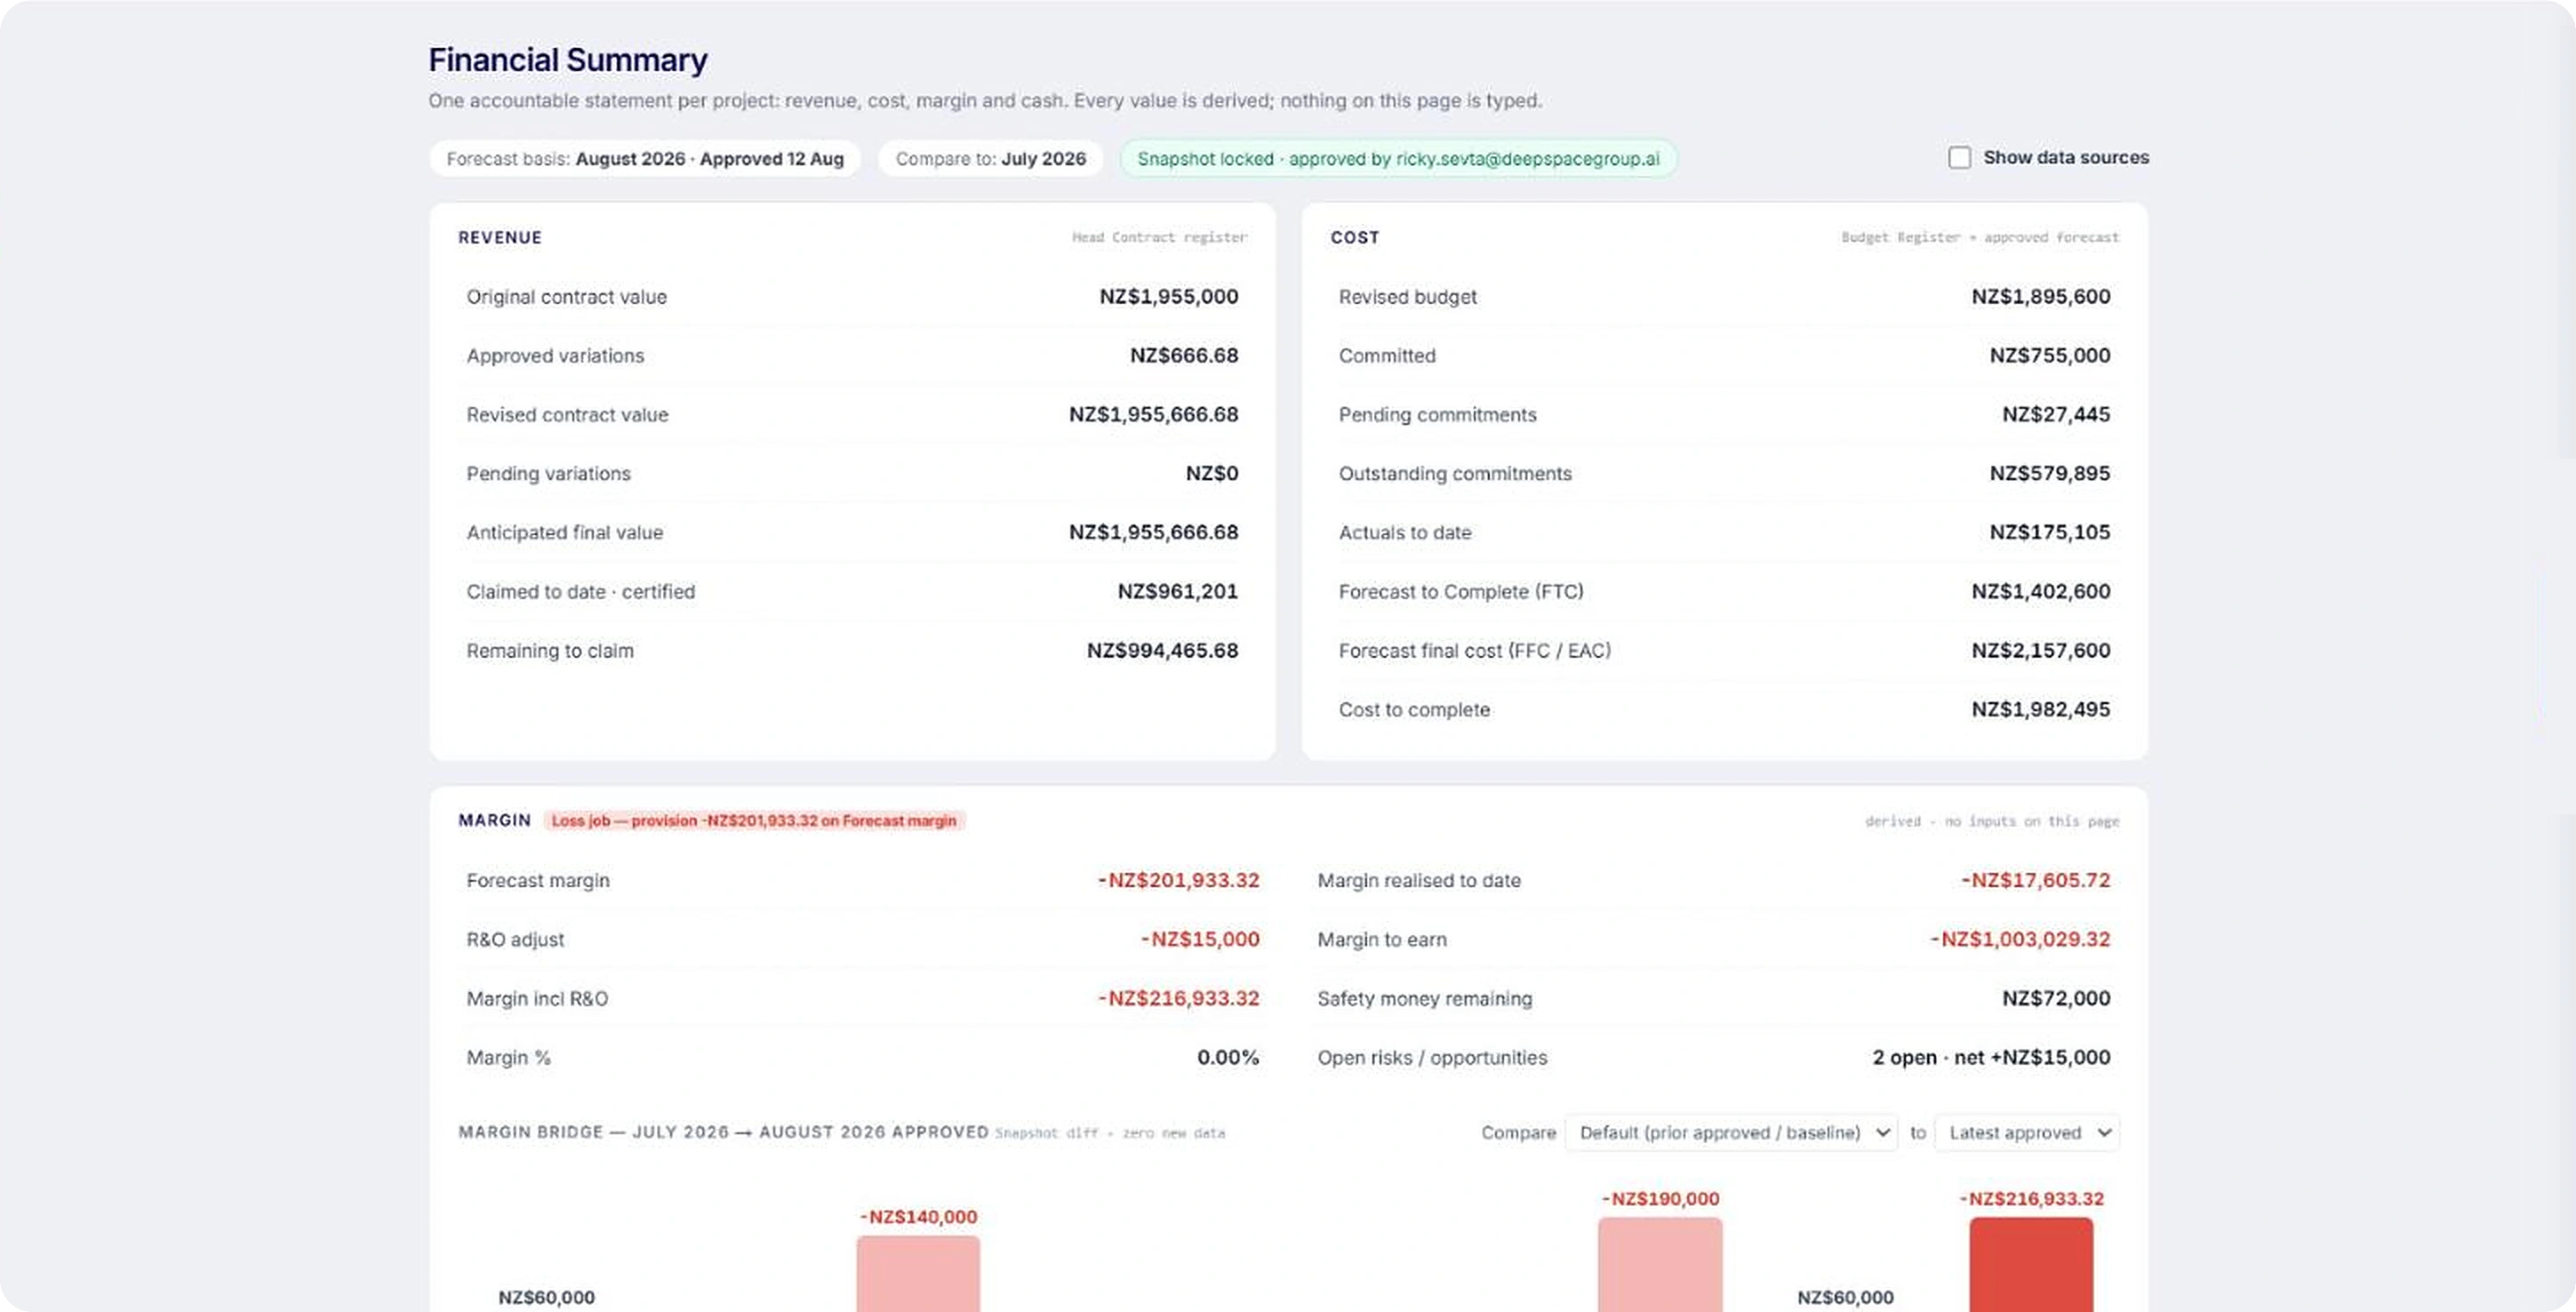
Nothing on this page
is typed
1
The Financial Summary, four blocks
Revenue, cost, margin and cash. Four blocks, one accountable statement per project. Revenue from the Head Contract register and claims, cost from the Budget Register on the approved forecast basis.
2
Every number shows its source
Every figure carries its own derivation. Turn on Show data sources and each number tells you the register, the line and the snapshot it came from. Ask a spreadsheet where a number came from and you get a name.
3
Snapshots you can compare month to month
Forecasts are approved, locked and snapshotted, with the approver's name on them. Compare any month against the one before, and the comparison is between two positions that were both signed off.
4
Risk and opportunity in WIP, never in the EAC
Risk and opportunity stays in the register and lands in the WIP report, never buried in the EAC. Forecast Margin and Margin incl R&O are two separate numbers, and safety money remaining is stated on its own line.
5
The WIP Journal your finance team asks for
Save the WIP position at month end and export the WIP Journal, with WIP prior and WIP movement, straight into the ledger. Your accountant gets the journal. Nobody rebuilds it in Excel.
Where the margin went, bar by bar
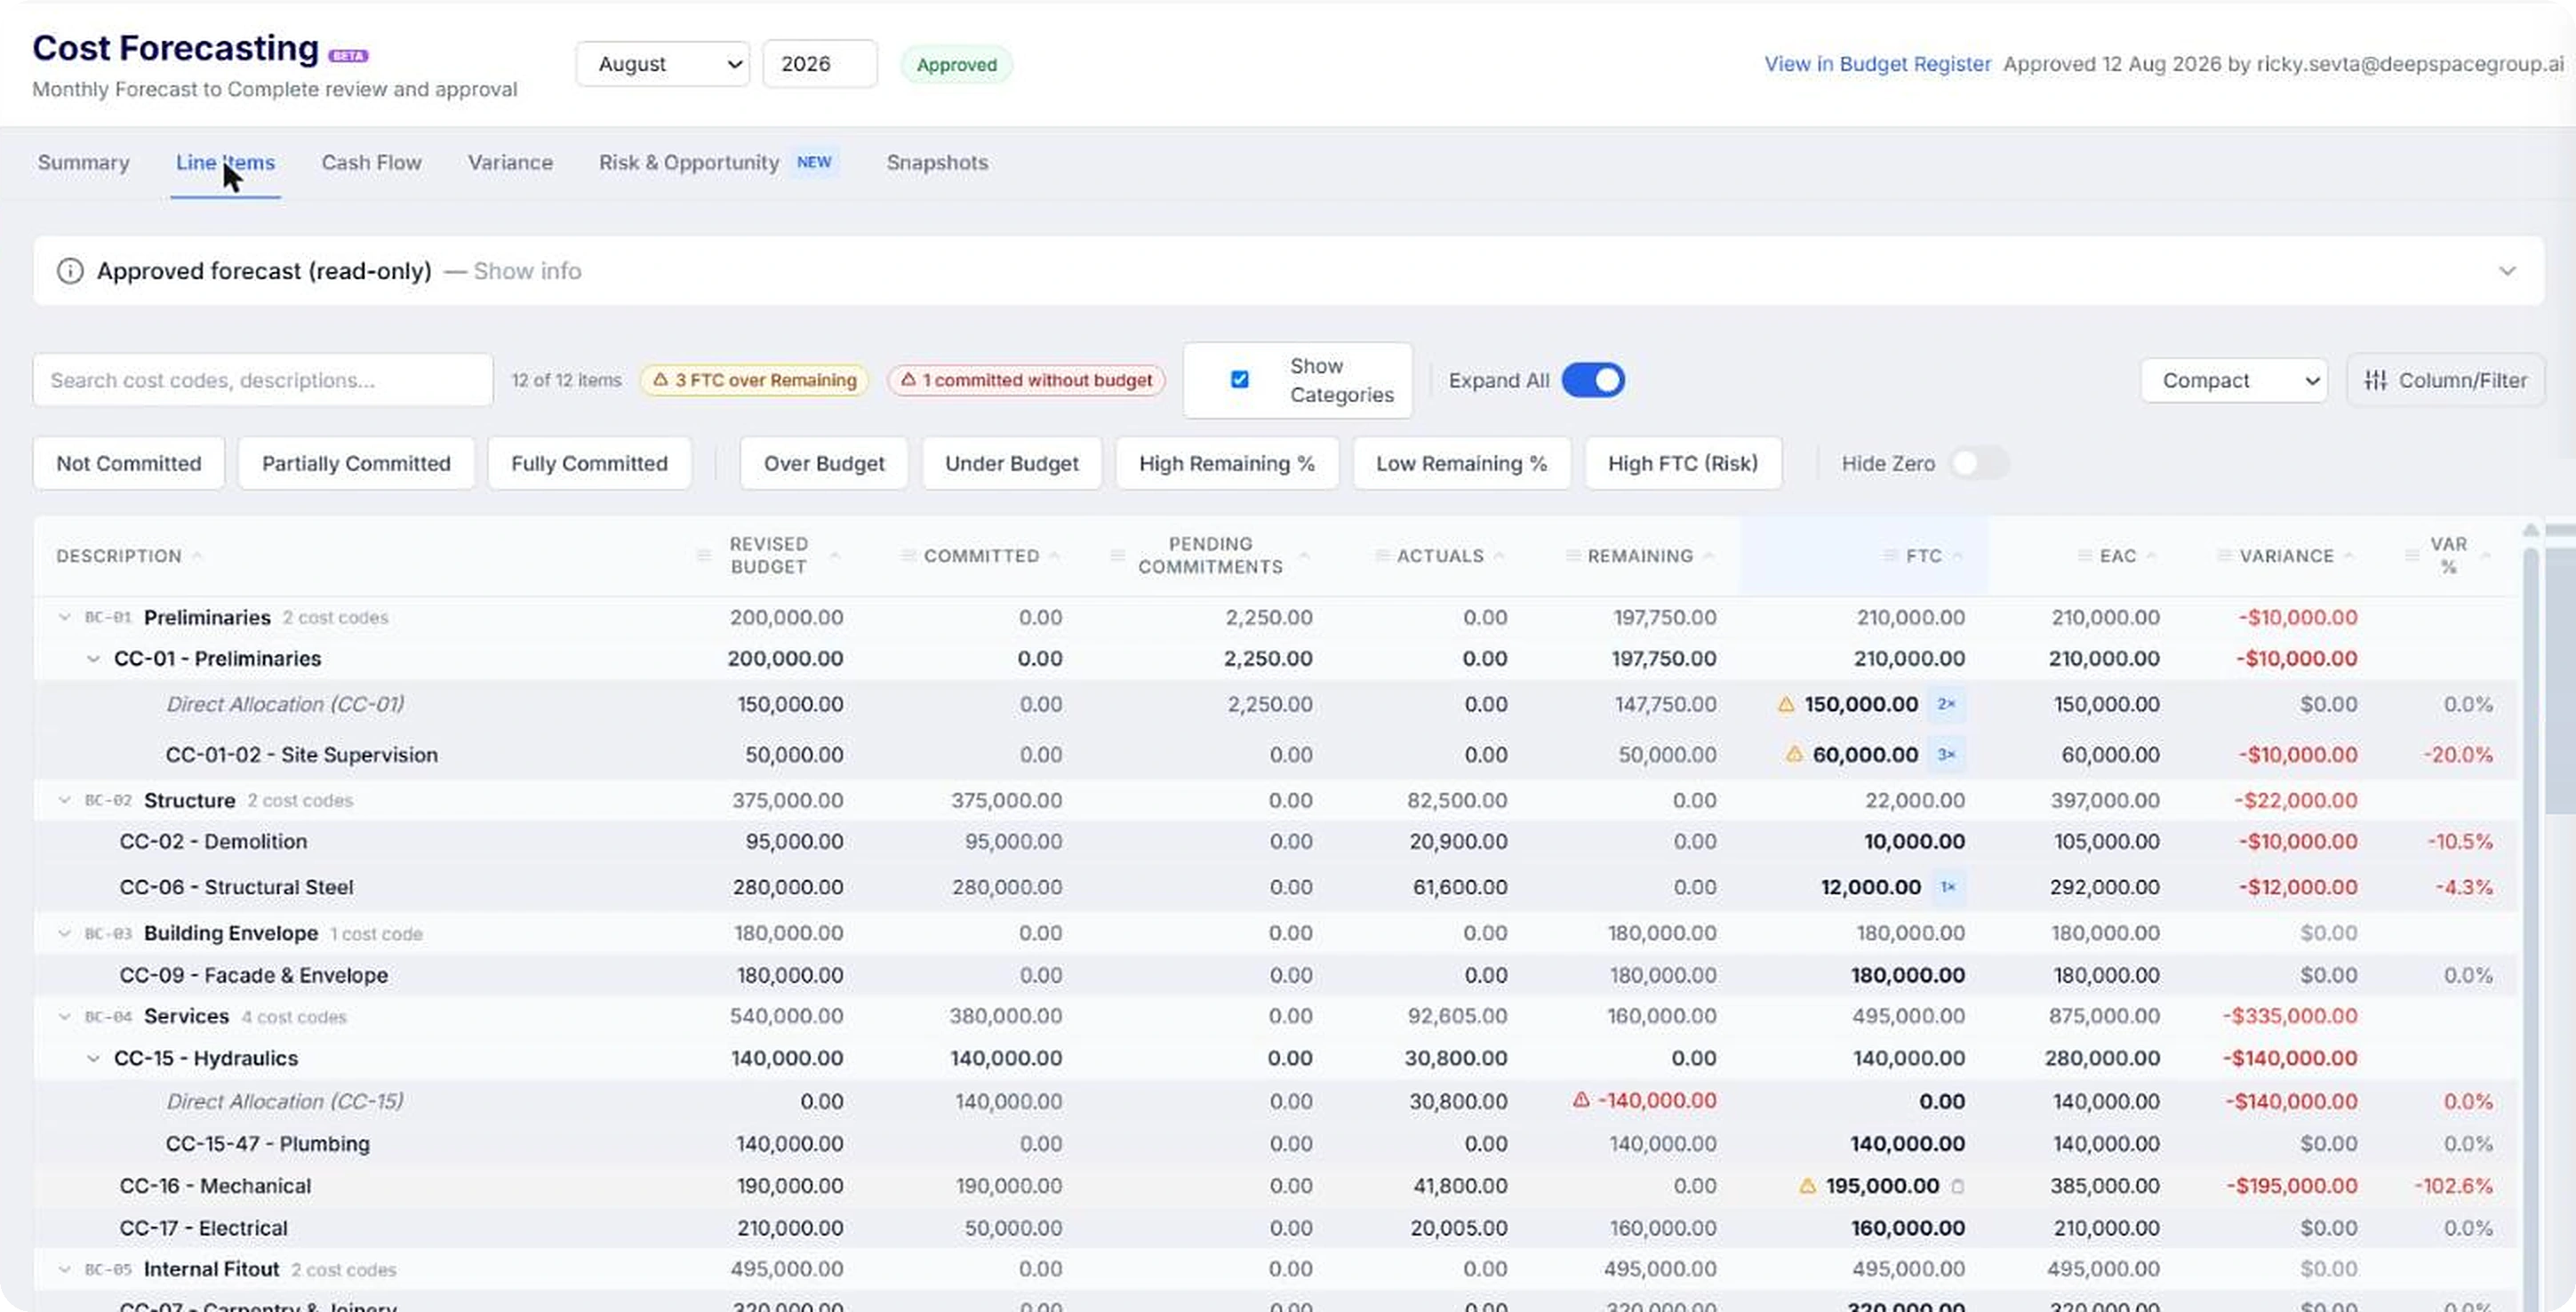
The number that matters is not this month's margin. It is what moved it. The margin bridge compares the prior approved snapshot against the current one and shows every cost code that changed.
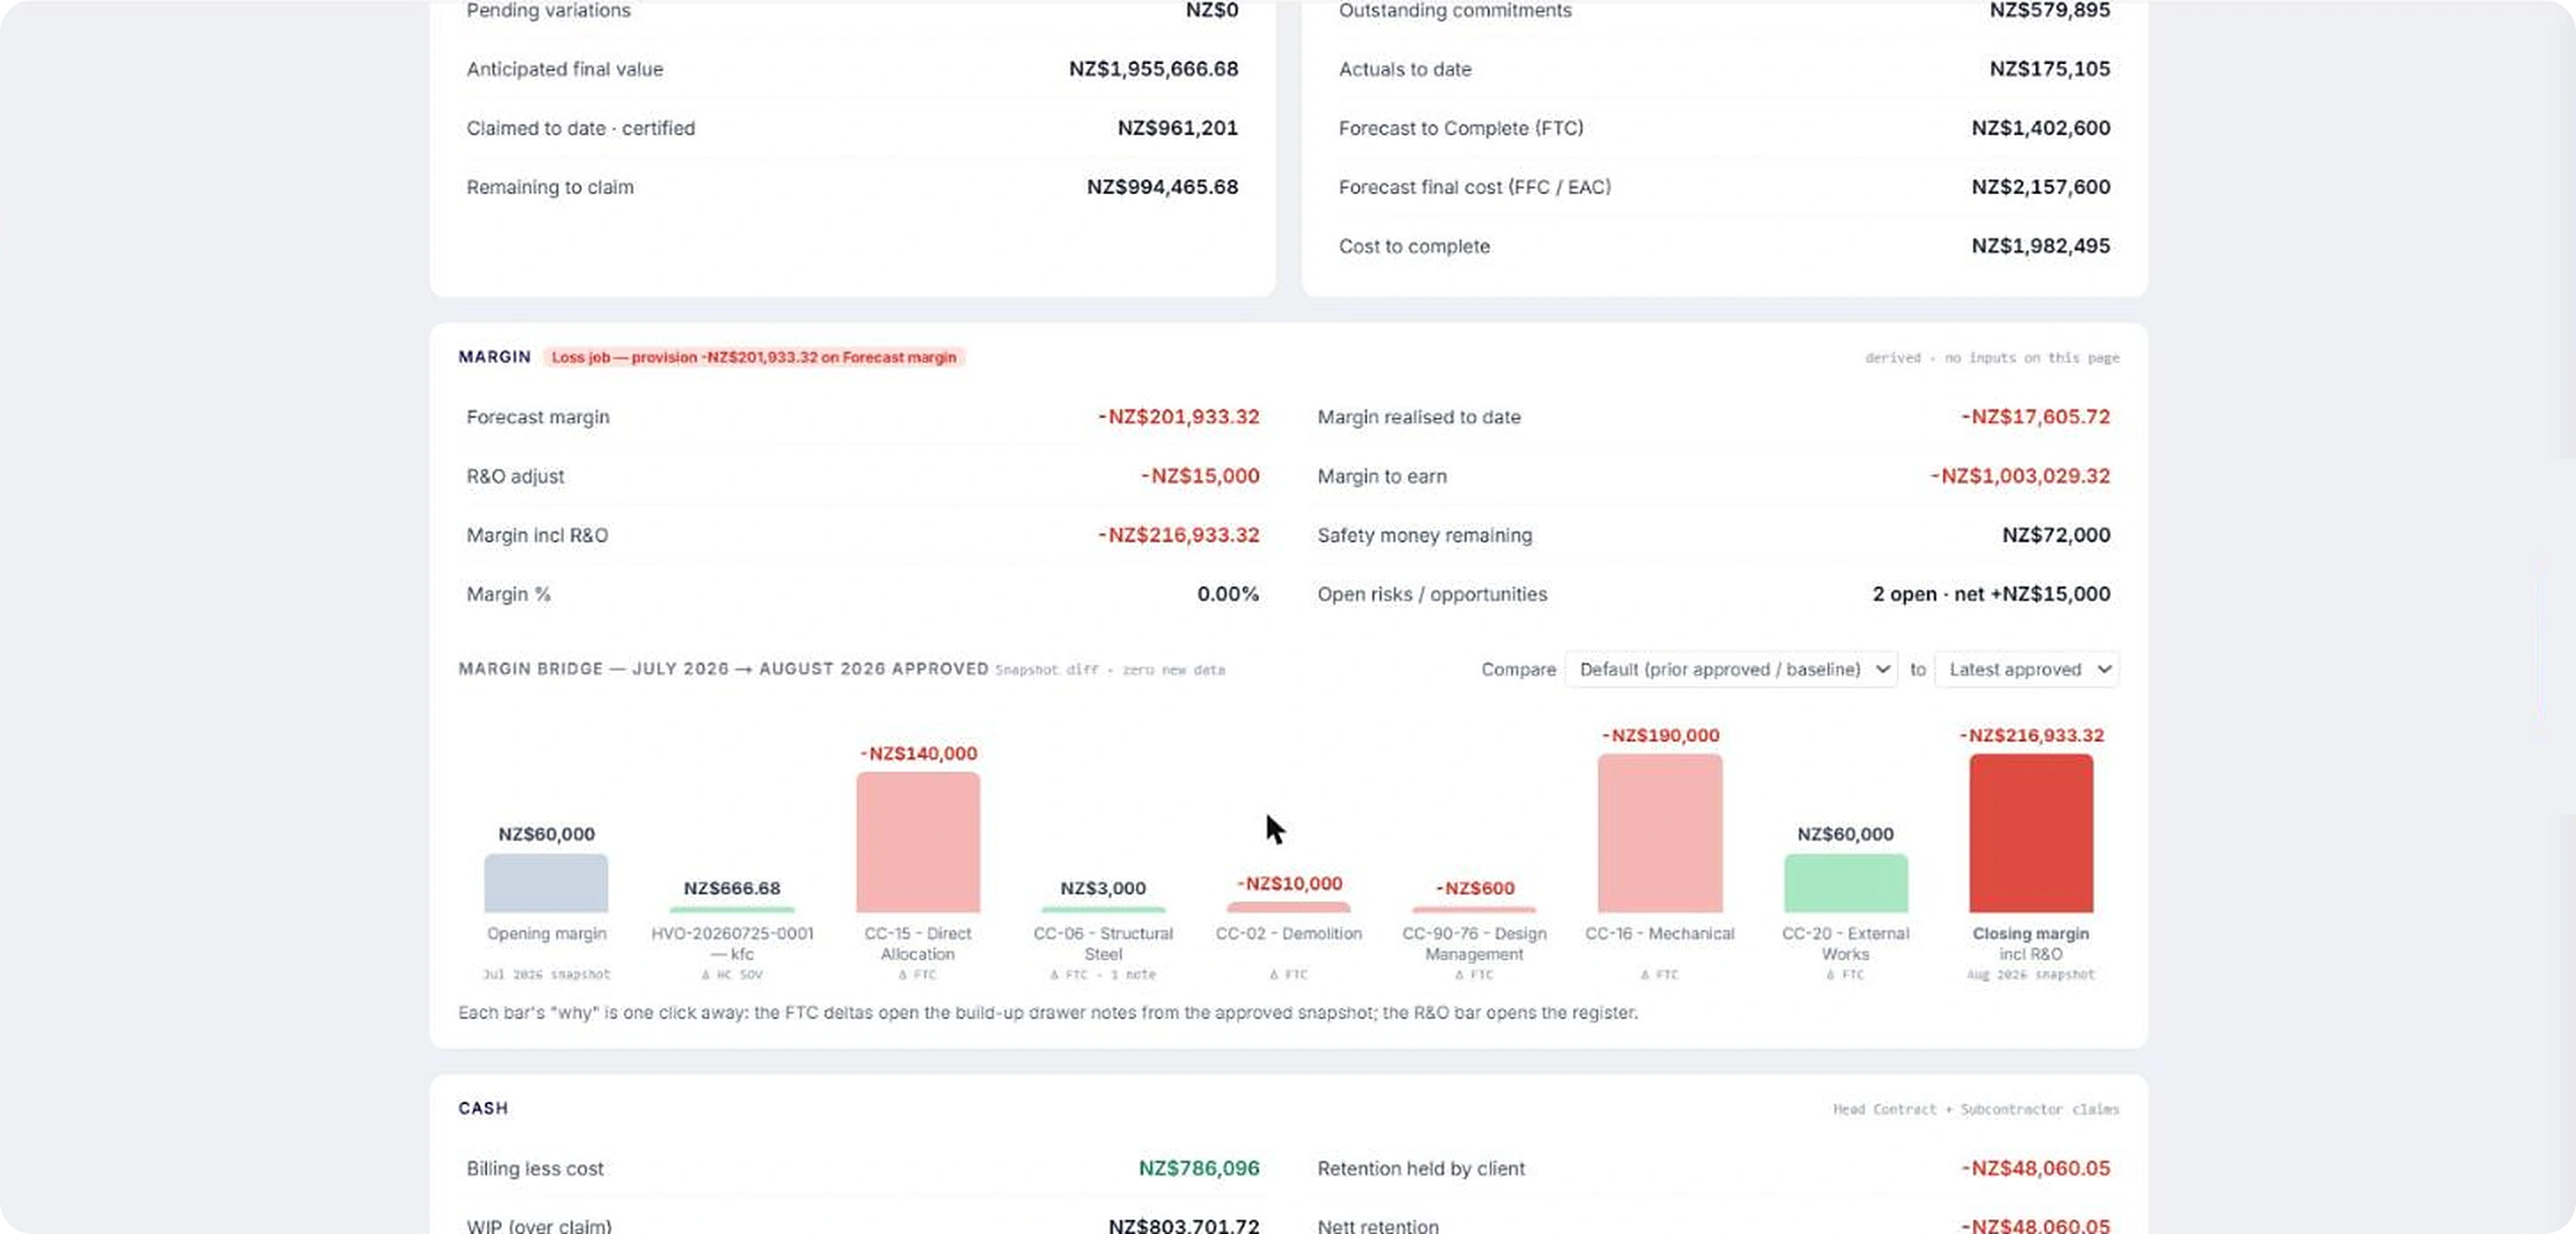
Mechanical took
$190,000 out of
the margin, and the
bridge shows it
Direct allocation
moved $140,000,
bar by bar
External works
gave $60,000 back,
visible in the
same view
The R&O bar opens
the register, FTC
deltas open the notes
That is the difference between knowing the margin dropped
and knowing which trade did it.
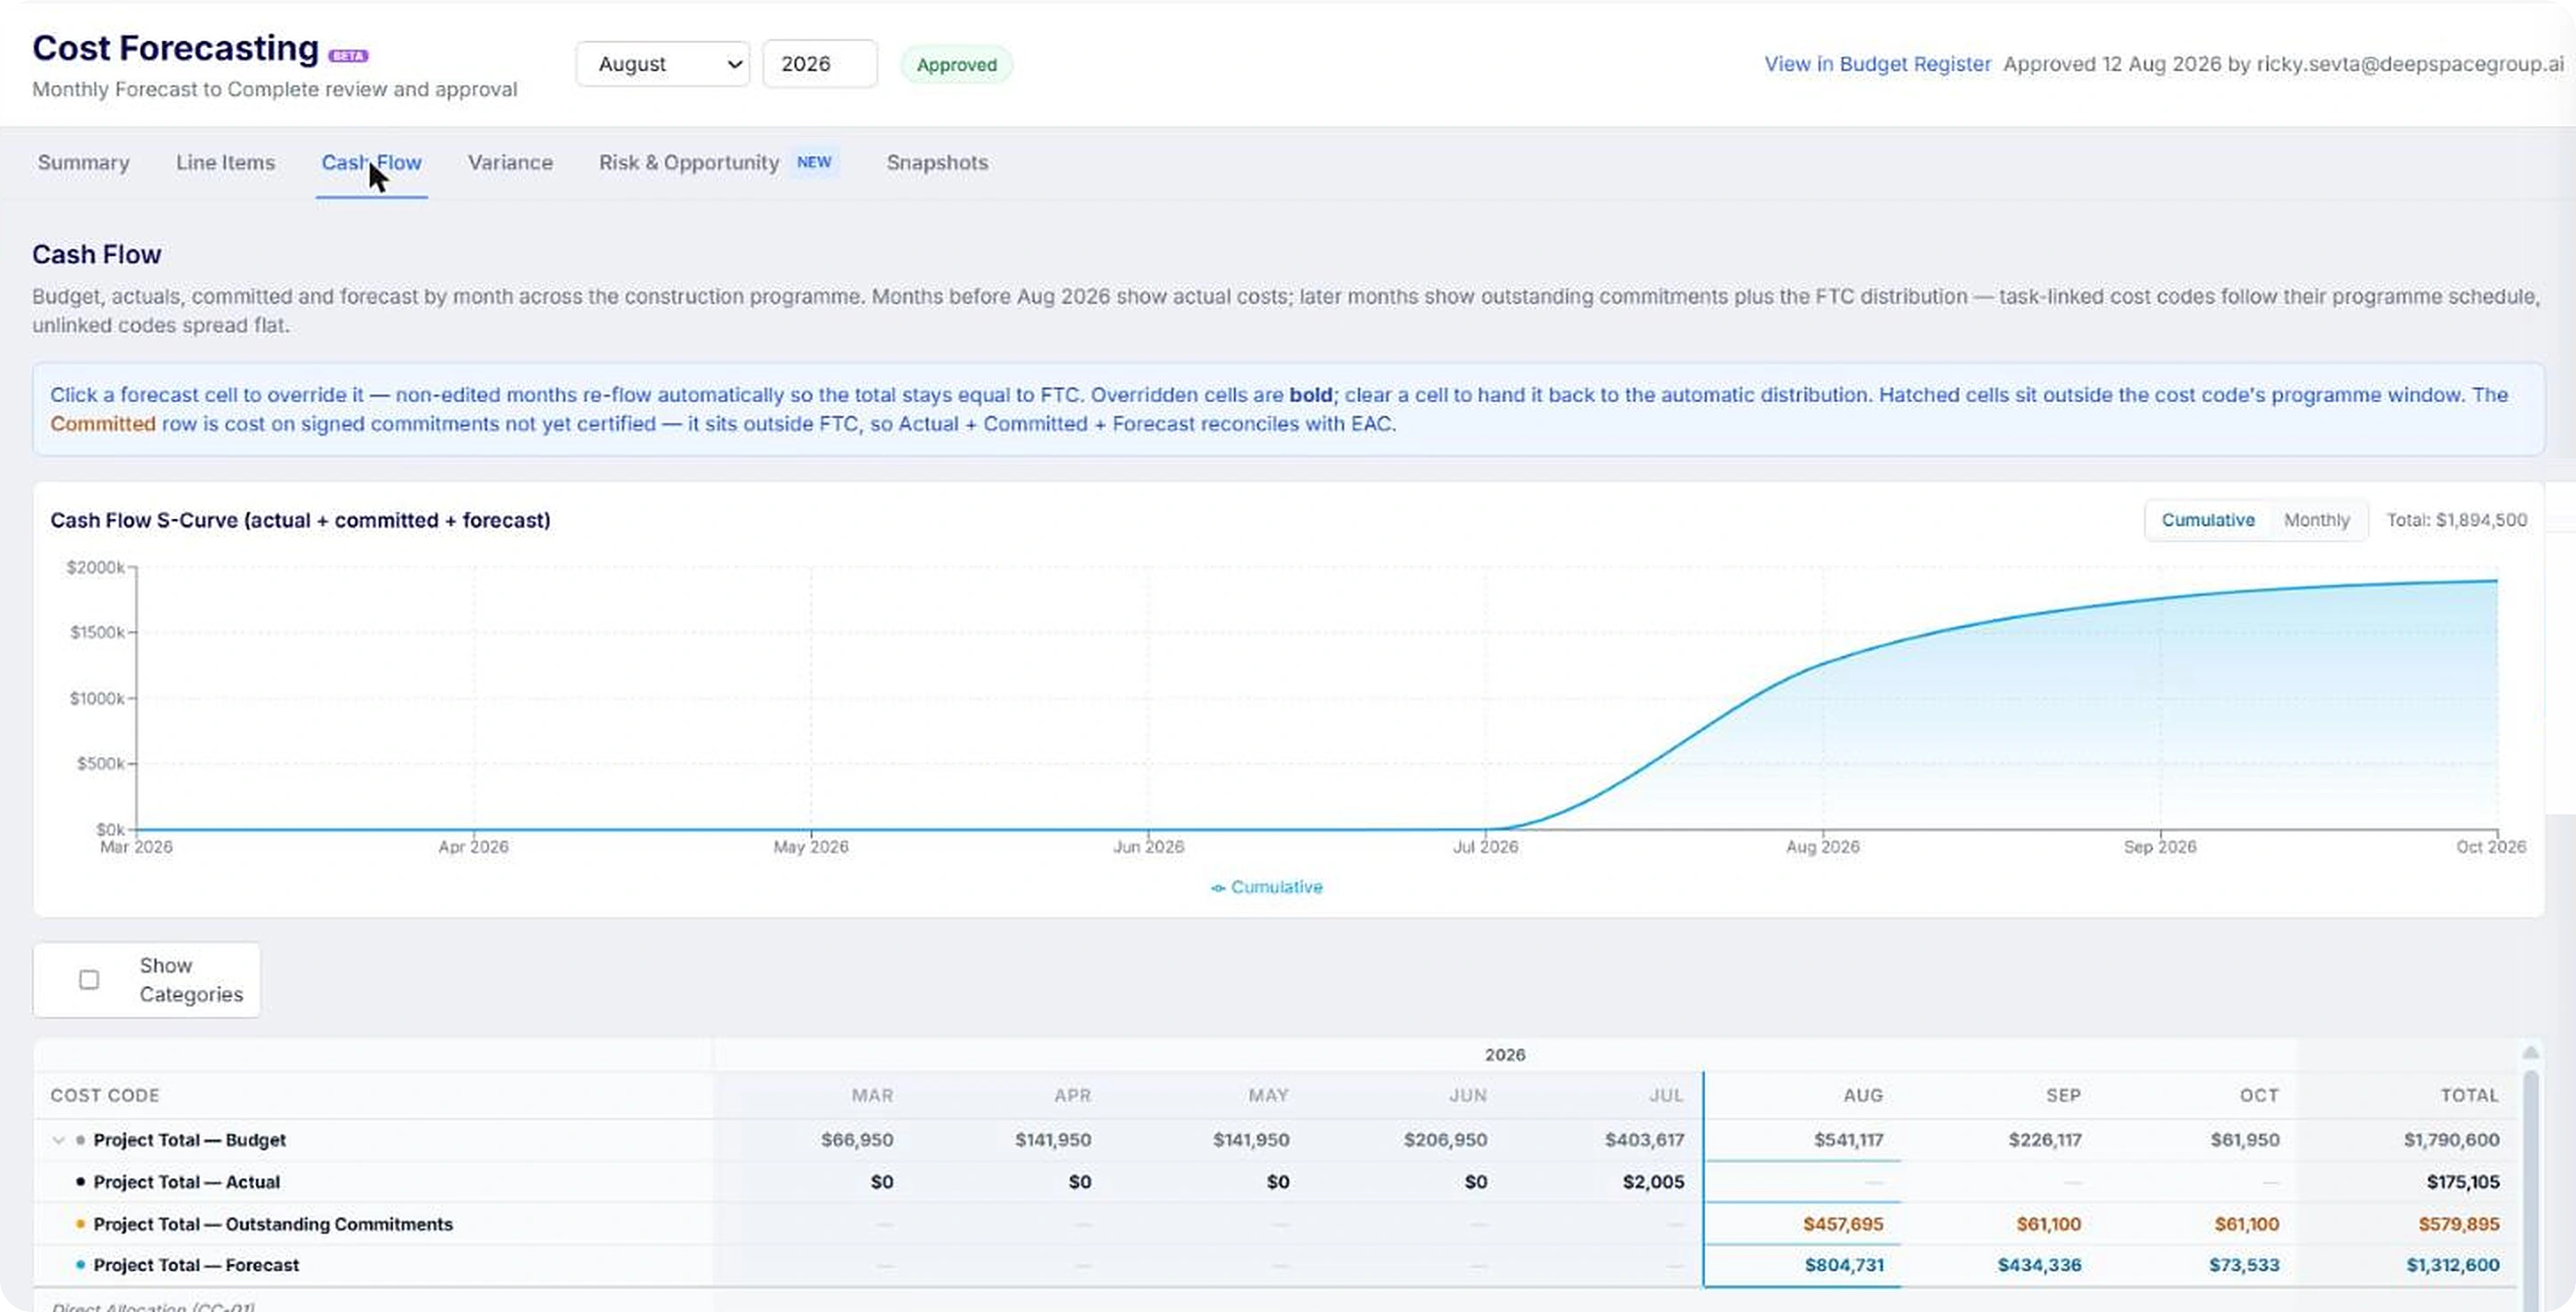
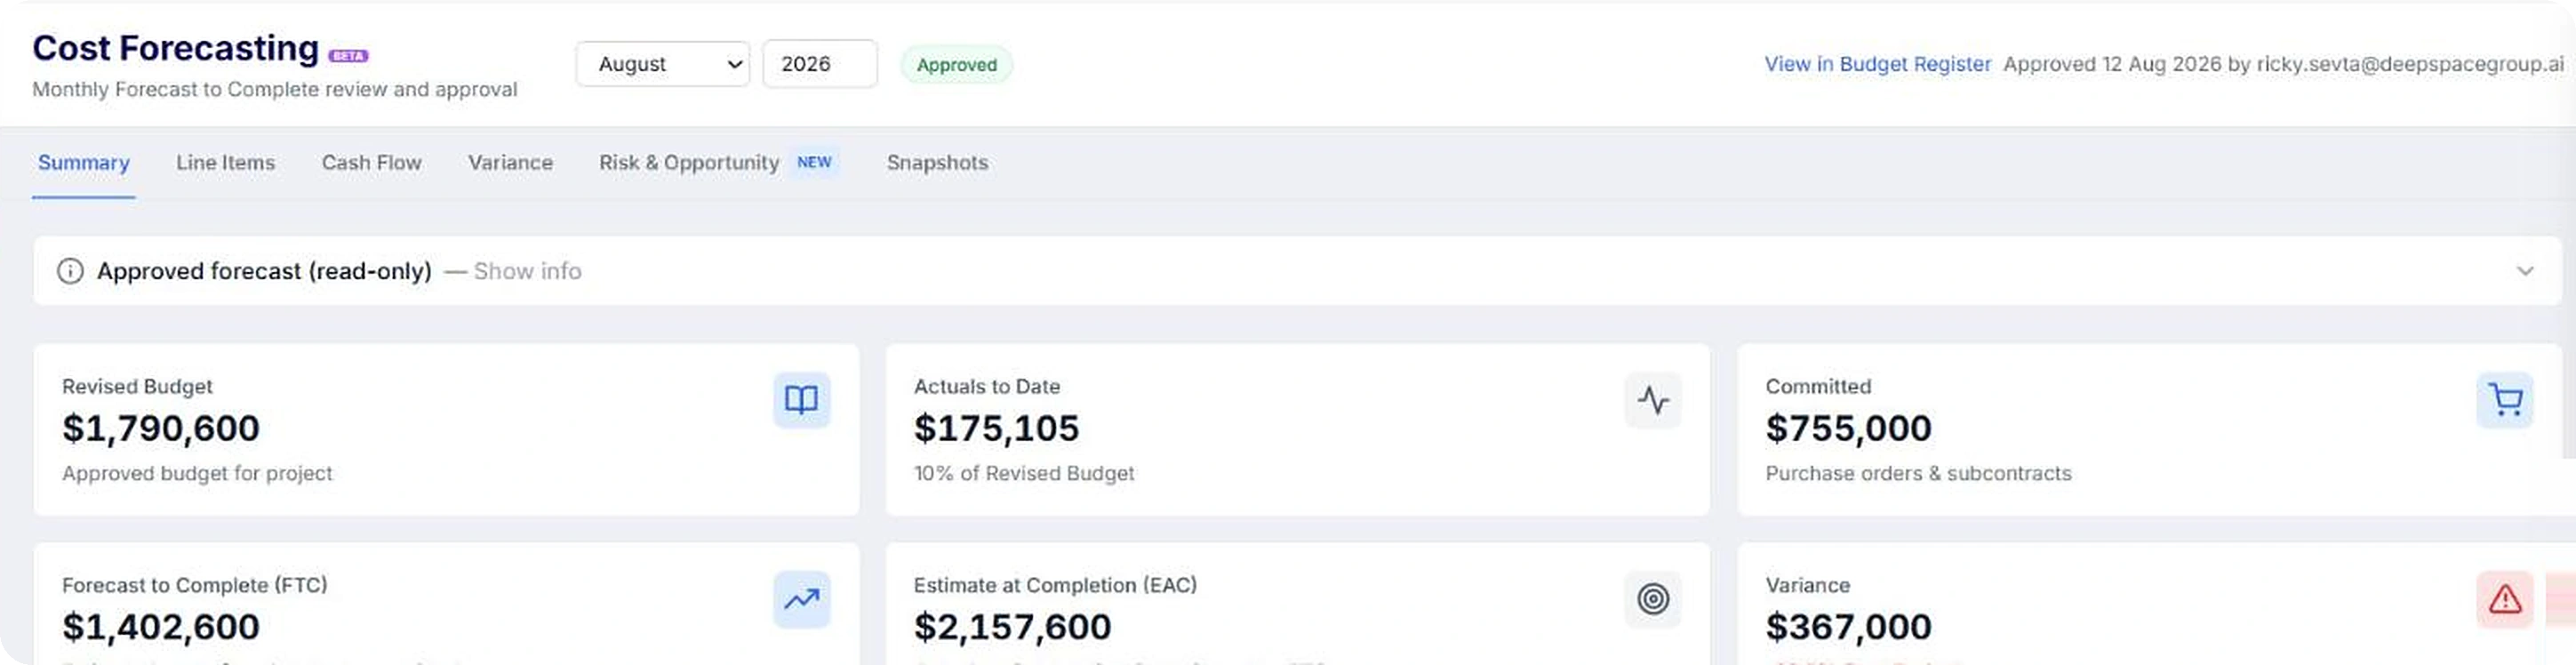
Every value, derived
Commercial
Managers
Directors and
Owners
Financial Controllers
Quantity
Surveyors
Project
Managers
Month-end WIP across every live job
Margin movement explained cost code by cost code
Cash flow that reconciles
to the EAC
Finding the loss job
while there is time to act
WIP Journal export straight into the ledger
An audit trail behind every number, without extra admin
The build-up behind the forecast
Every live job on one line
Bring your
worst job
.png)


.png)